
文章目录
- 查看当前ES状态
- 新增节点配置
- 遇到的问题
查看当前ES状态
这里默认都是在Kibana进行操作
GET _cluster/health

{
  "cluster_name" : "bjga-gz",
  "status" : "yellow",
  "timed_out" : false,
  "number_of_nodes" : 1,
  "number_of_data_nodes" : 1,
  "active_primary_shards" : 747,
  "active_shards" : 747,
  "relocating_shards" : 0,
  "initializing_shards" : 0,
  "unassigned_shards" : 31,
  "delayed_unassigned_shards" : 0,
  "number_of_pending_tasks" : 0,
  "number_of_in_flight_fetch" : 0,
  "task_max_waiting_in_queue_millis" : 0,
  "active_shards_percent_as_number" : 96.01542416452442
}
head查看索引信息
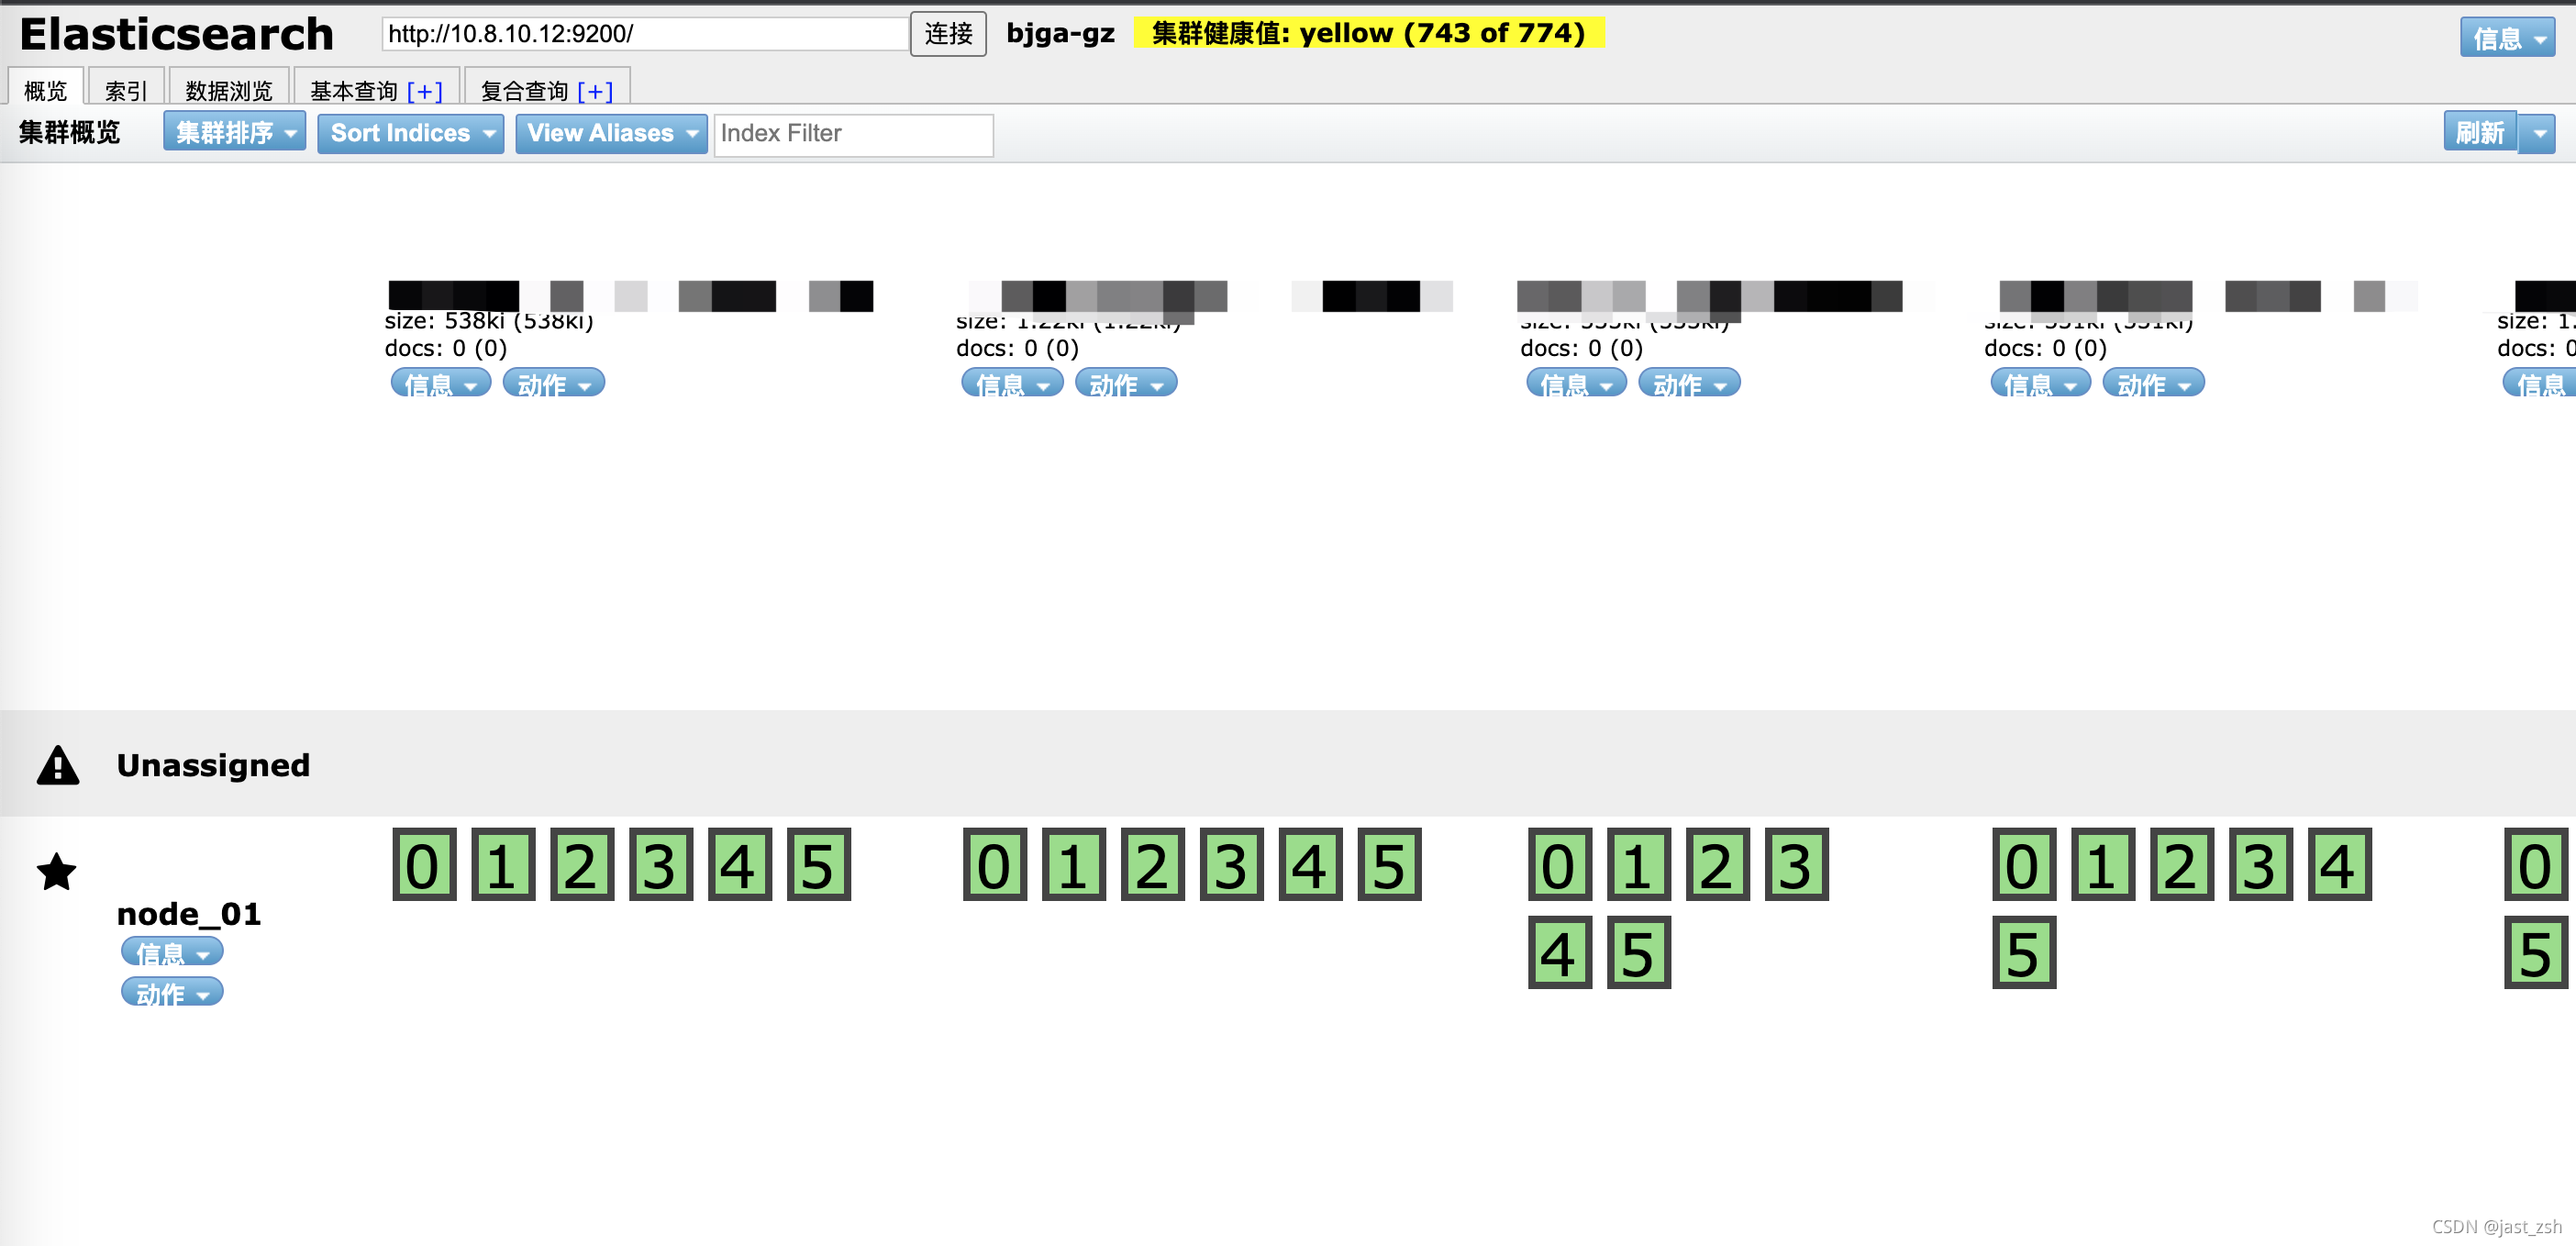
现在只有一个节点
新增节点配置
elasticsearch.yml
# ======================== Elasticsearch Configuration =========================
cluster.name: bjga-gz
node.name: node_02
network.host: 10.8.10.13
node.master: true
node.data: true
# head 插件需要这打开这两个配置
http.cors.allow-origin: "*"
http.cors.enabled: true
http.max_content_length: 200mb
# 可以选举的主节点
cluster.initial_master_nodes: ["10.8.10.12:9300","10.8.10.13:9300"]
discovery.seed_hosts: ["10.8.10.12:9300","10.8.10.13:9300"]
gateway.recover_after_nodes: 1
network.tcp.keep_alive: true
network.tcp.no_delay: true
transport.tcp.compress: true
#集群内同时启动的数据任务个数,默认是2个
cluster.routing.allocation.cluster_concurrent_rebalance: 16
#添加或删除节点及负载均衡时并发恢复的线程个数,默认4个
cluster.routing.allocation.node_concurrent_recoveries: 16
#初始化数据恢复时,并发恢复线程的个数,默认4个
cluster.routing.allocation.node_initial_primaries_recoveries: 16
#开启 xpack 功能,如果要禁止使用密码,请将以下内容注释,直接启动不需要设置密码
#xpack.security.enabled: true
#xpack.security.transport.ssl.enabled: true
#xpack.security.transport.ssl.verification_mode: certificate
#xpack.security.transport.ssl.keystore.path: elastic-certificates.p12
#xpack.security.transport.ssl.truststore.path: elastic-certificates.p12
#
path.repo: ["/home/es/snapshot"]
这里注意,如果我们第一个节点/集群装有插件,比如ik等,需要在新增的节点中也同时增加进去。不然第二个节点会报错
配置时将第一个节点的IP加入,然后启动服务
bin/elasticsearch -d -p pid
此时我们再Kibana中查看
GET _cluster/health
{
"cluster_name" : "bjga-gz",
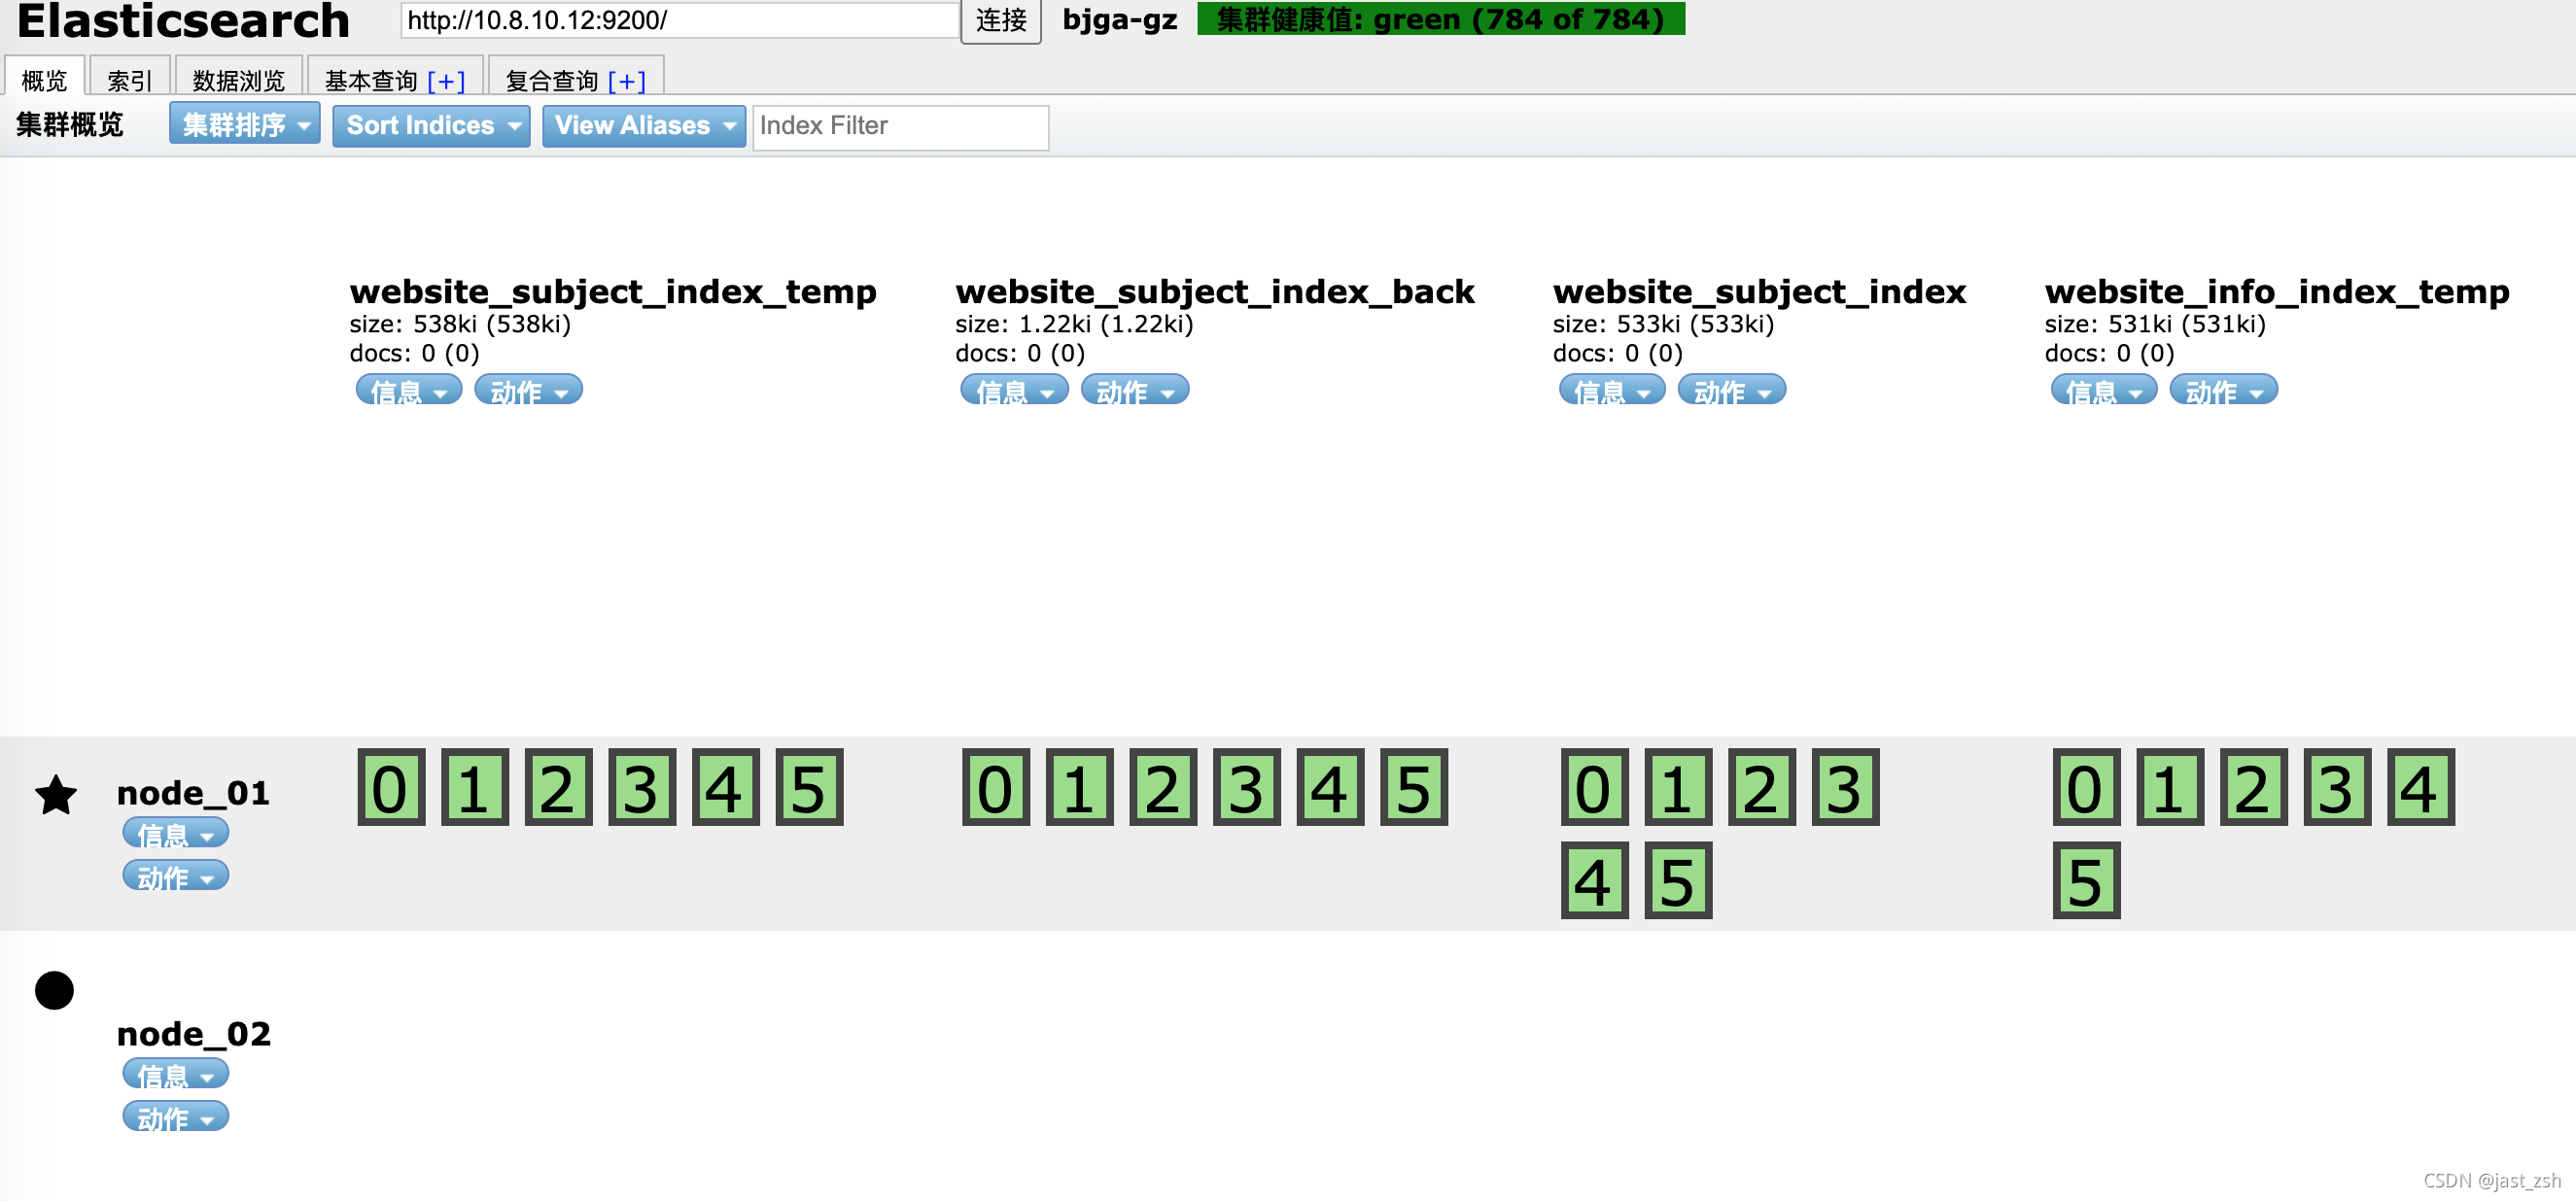
"status" : "green",
"timed_out" : false,
"number_of_nodes" : 2,
"number_of_data_nodes" : 2,
"active_primary_shards" : 747,
"active_shards" : 792,
"relocating_shards" : 11,
"initializing_shards" : 0,
"unassigned_shards" : 0,
"delayed_unassigned_shards" : 0,
"number_of_pending_tasks" : 4,
"number_of_in_flight_fetch" : 0,
"task_max_waiting_in_queue_millis" : 2143,
"active_shards_percent_as_number" : 100.0
}
此时"status" : "green",可以看到状态变成了green,之前为yellow是因为一个节点原因。节点数也为2了。
我们通过Head查看,发现节点已经加入成功。
再过一段时间自动负载完成
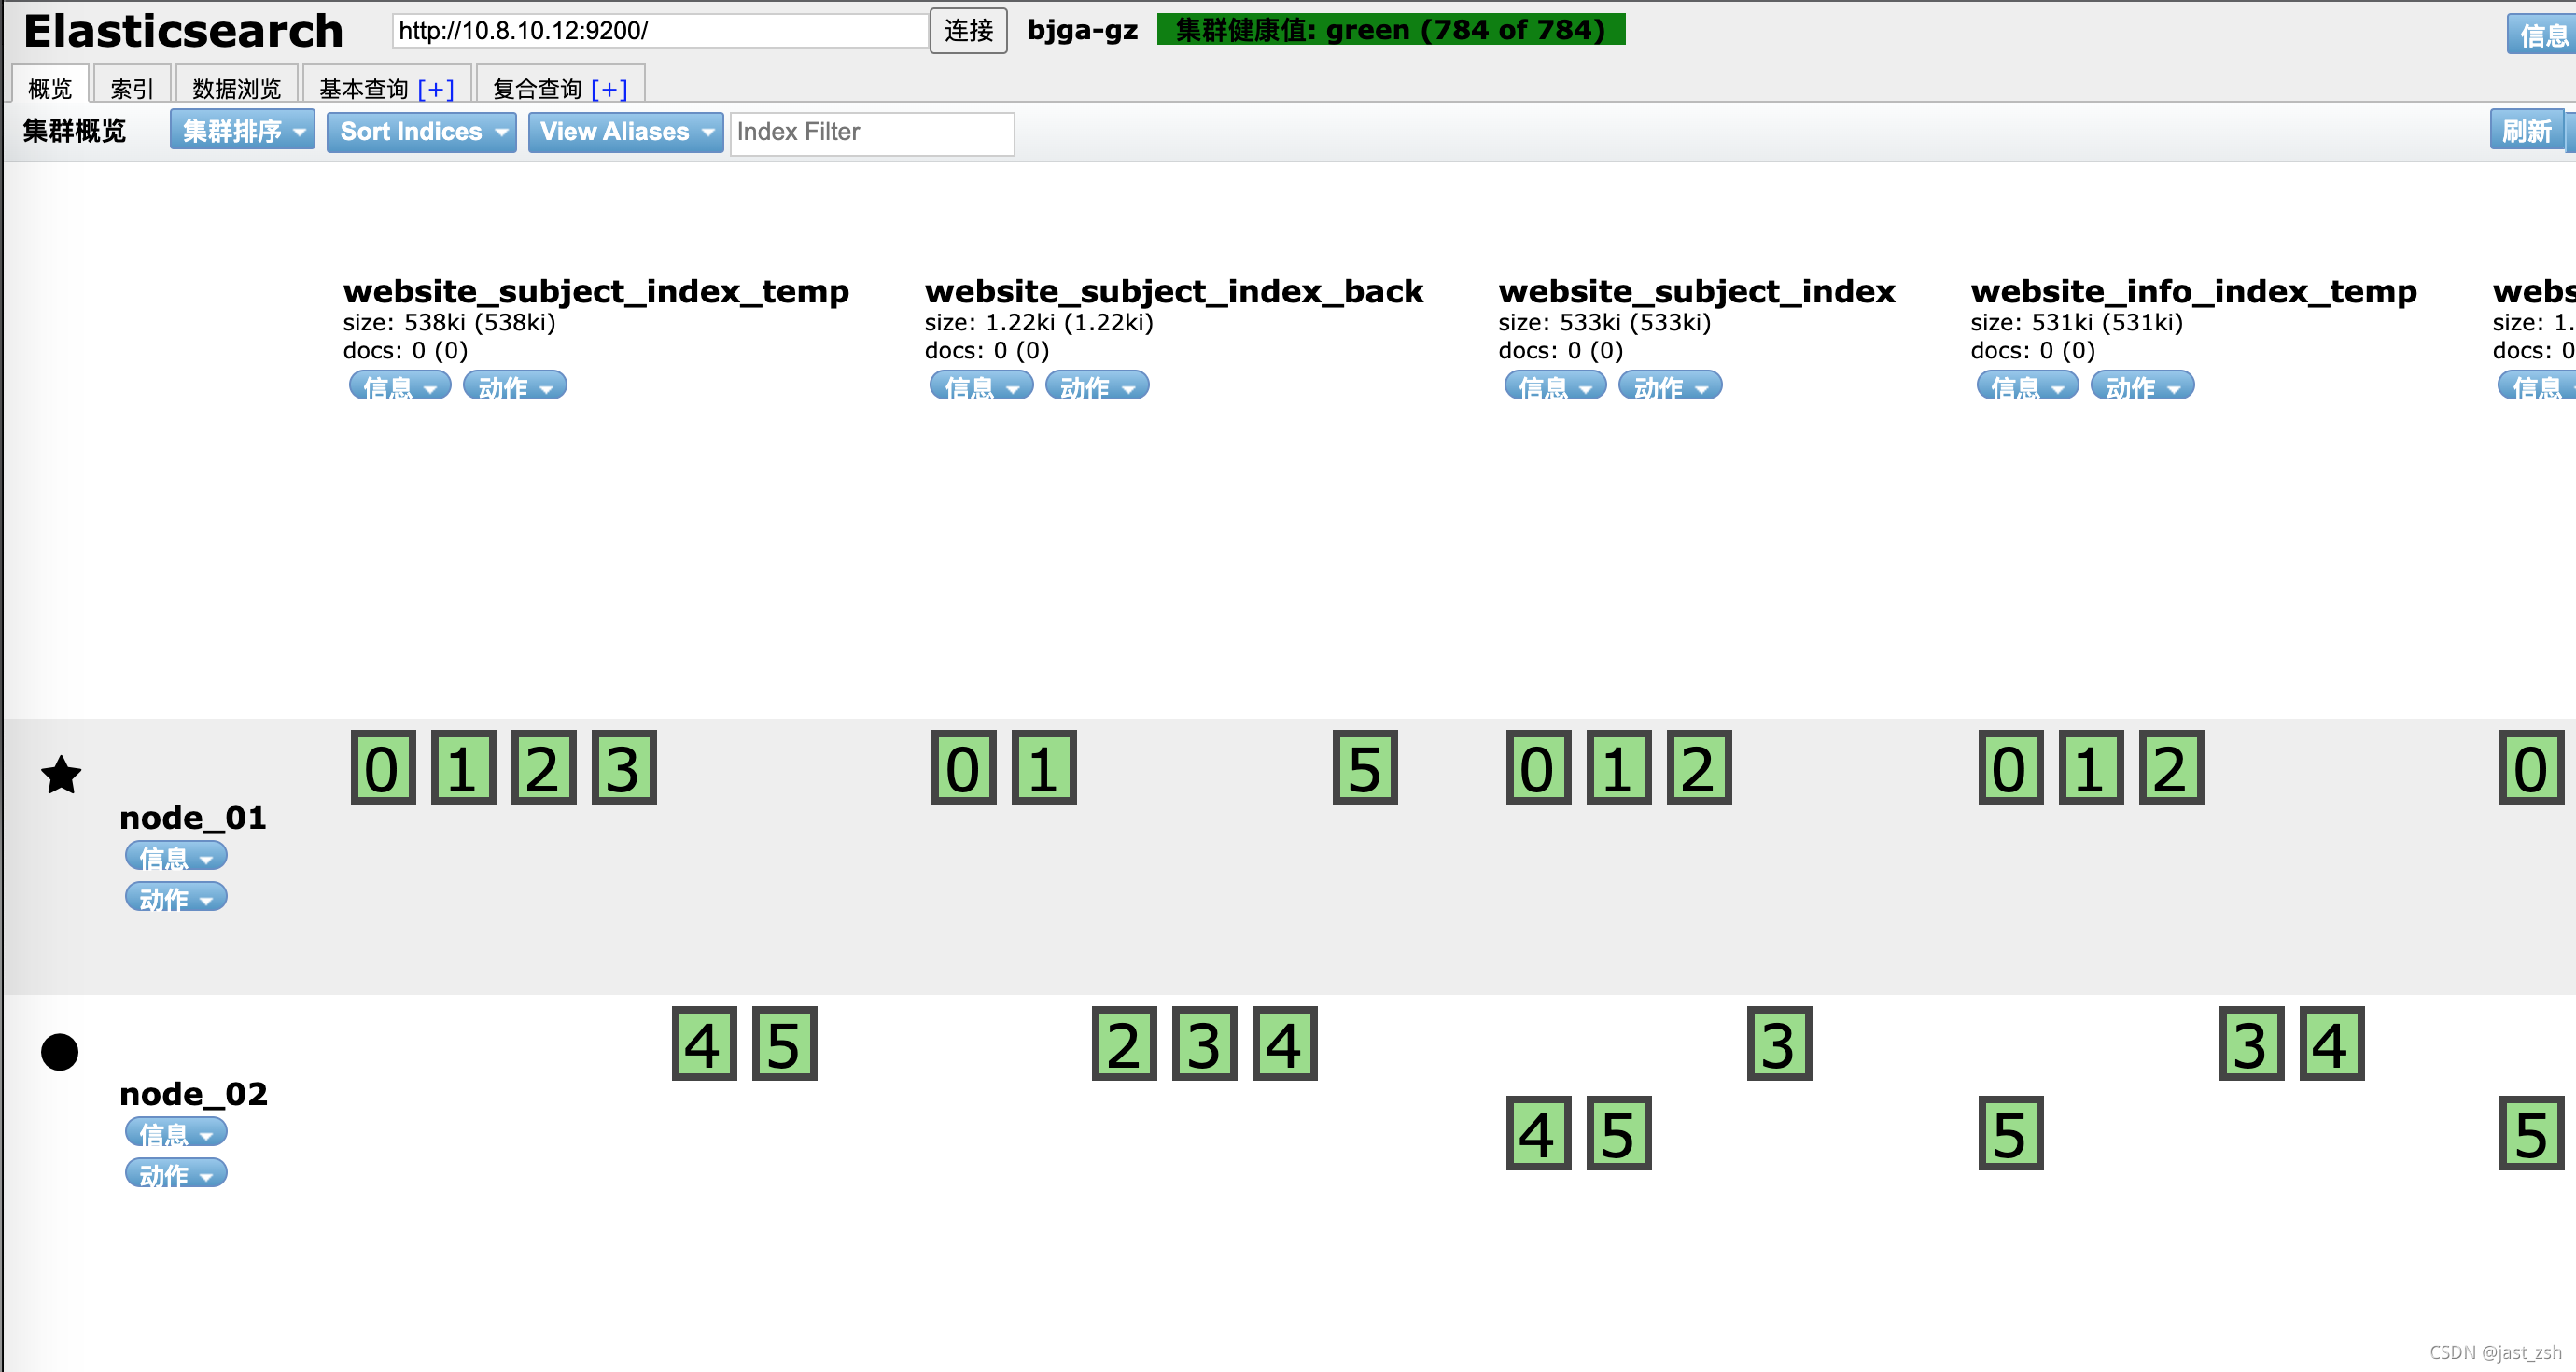
通过新增服务的接口访问也可正常查看数据。
新增节点后,原先的主节点配置文件也同步进行更新,但是也可以先不重启服务,后期有机会在进行重启即可。不影响使用。
主要是将下面ip同步更新到之前的节点中
cluster.initial_master_nodes: ["10.8.10.12:9300","10.8.10.13:9300"]
discovery.seed_hosts: ["10.8.10.12:9300","10.8.10.13:9300"]
遇到的问题
访问新增节点服务提示404
此时我们通过新增服务器的端口进行查询数据、查看索引,发现提示404
[es@test13 elasticsearch-7.9.3]$ curl -XGET http://10.8.10.13:9200/operator_index/_search
{"timestamp":"2021-11-03T12:48:45.448+00:00","status":404,"error":"Not Found","message":"","path":"/operator_website_index/_search"}
[es@test13 elasticsearch-7.9.3]$ curl -XGET http://10.8.10.13:9200/_cat/indices
{"timestamp":"2021-11-03T12:49:09.587+00:00","status":404,"error":"Not Found","message":"","path":"/_cat/indices"}
查看我们的es启动服务端口,我们发现es使用的9202和9301
[root@test13 elasticsearch-7.9.3]# netstat -antp |grep 29559 |grep 'LISTEN'
tcp6       0      0 10.8.10.13:9202         :::*                    LISTEN      29559/java
tcp6       0      0 10.8.10.13:9301         :::*                    LISTEN      29559/java
为什么配置了9300,他不使用呢?
查看了下9200和9300分别被其他程序占用了!es自动分配到了其他端口,使用9202进行http查询可以正常查询了。
[root@test13 elasticsearch-7.9.3]# netstat -antp |grep 9200
tcp6       0      0 :::9200                 :::*                    LISTEN      32632/java
[root@test13 elasticsearch-7.9.3]# netstat -antp |grep 9300 |grep 'LISTEN'
tcp6       0      0 :::9300                 :::*                    LISTEN      4667/java